
By Laurie Post, Ph.D.
When undesirable microorganisms are detected in a production lot, root cause analysis often includes testing additional samples from the affected lot or related lots of product. However, upon reanalysis, even when a larger sample size is used, the suspect organism cannot be detected in the retest analysis. Correlation differences between original and retest results can occur for several reasons:
- Distribution pattern of the microorganisms
- Lack of representative sampling
- Organism die-off
- Level of contamination and probabilities of detection
Distribution
The distribution pattern of microorganisms in a production lot affects the likelihood of detecting the organism in the product. For instance, distribution patterns can be Random or Non-Random.
Random Distribution: Microorganisms are distributed evenly throughout the entire lot. Microorganisms will likely be detected. This type of microbial distribution is not a factor of time since at any point in the sampling process there is an equal opportunity to detect the organism in question (Example A).
Non-random Distribution: Microorganisms are not distributed evenly throughout the entire lot. Microorganisms may not be detected by random sampling. This type of distribution is dependent on time since the microbial contamination is only represented at certain intervals in the production cycle without equal opportunity for detection (Examples B and C)
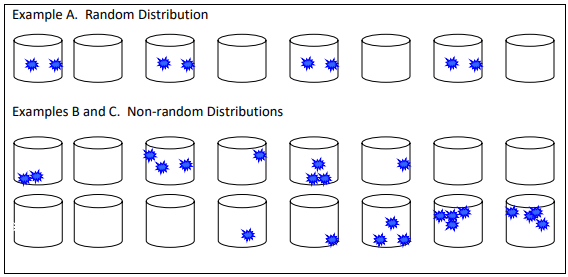
Example B shows a non-random distribution pattern of organisms that can be present at the startup of production. In this case, the food actually cleans the line, so that over time the contaminant is reduced to undetectable levels. If a retest sample of this lot of production is pulled from containers made later in the day, then the retest results will be negative for the target organism, even though the organism was present.
Example C is another example of non-random microbial distribution that can occur when condensate drips onto exposed product. Condensate began to drip sometime after startup and continues throughout the rest of the day, increasing toward shutdown. If retain samples taken at the beginning of the day were selected for retest analysis, the retest samples would likely be negative for the target organism even
though the organism was present in that lot of production.
Sampling
Microbiological analyses are only as good as the sampling procedure used to procure the sample. Every effort must be made to obtain a RANDOM SAMPLE. “Spot sampling” or taking a single sample will not yield a representative sample. FDA recommends taking 30 random 25g samples during the entire production run for Ready-to-Eat products that will be consumed without a process lethal to microbial pathogens. These include products such as cereals, confectionary products, cheese, dairy, spices – and many others (FDA Bacteriological Analytical Manual). For fluid and powdered products, most manufacturers employ mechanical or auto-samplers. For discrete products, samples are taken on a time production basis (i.e. one candy bar every half hour) and then the analytical unit (the actual amount tested) is made by compositing. Compositing must be performed carefully and thoughtfully, not only to ensure a representative sample, but also to avoid sample contamination.
Organism Die-off
Organisms contaminating a product may not survive at the same level for long periods of time. For example, Escherichia coli (E. coli) is not capable of long-term survival in an inhospitable matrix, such as chocolate, and will eventually die off. Levels may fall below the ability of an assay to detect the organism.
Levels of Contamination and Probability of Detection
The probability of finding a target organism in a retest sample is based on the probability of finding the target organism in the original sample. If 10 samples are collected for analysis and only one tests positive for a pathogen, the level of contamination is one in ten or 10%. Based on a standard statistical analysis, if there is a 10% chance of finding the target organism in the original sample, then the ability of finding the organism a second time by retest sampling is [10% X 10%] or [0.10 X 0.10 = 0.01] or one in a hundred. Similarly, if the level of contamination is 5%, the probability of finding the positive a second time is one in twenty-five and 1% is one in ten thousand. The short hand version of this is to simply square the level of
contamination, as shown here:
| Level of Contamination- Probability of Finding the Target Organism in the Original Sample | Probability of Finding the Target Organism in a Retest Sample | |
| One in two (50%) | One in four (25%) | |
| One in four (25%) | One in sixteen (6.5%) | |
| One in five (20%) | One in twenty five (2.5%) | |
| One in ten (10%) | One in a hundred (1%) | |
| One in a hundred (1%) | One in ten thousand (0.01%) |
There are many factors that can result in correlation differences between original and retest results. But, if a retest is desired, pull many random samples and request a retest as soon as possible.