• Skip to primary navigation
  • Skip to main content
  • Skip to footer
Deibel Laboratories

Deibel Laboratories

Science you can trust from concept to consumer.

  • ABOUT US
    • MEET OUR STAFF
    • ACCREDITATION
    • TERMS AND CONDITIONS
  • SERVICES
    • TESTING SERVICES
      • MICROBIOLOGY
      • CHEMISTRY
      • BACTERIAL / FUNGAL IDENTIFICATION
      • ALLERGEN TESTING
      • NUTRIENT ANALYSES FOR LABELING AND CLAIMS
      • TOXIN TESTING
      • FDA DETENTION SAMPLING
      • PERSONAL CARE & COSMETICS
    • SPECIAL PROJECTS
      • CHALLENGE STUDIES
      • SHELF LIFE STUDIES
      • PROCESS VALIDATION
      • METHOD/MATRIX VALIDATION
    • ADVISORY SERVICES
    • ENVIRONMENTAL MONITORING SERVICES
    • BIOFUELS
    • DEIBEL COLAB 2.0
  • TRAINING AND EDUCATION
    • HACCP TRAINING
    • FSPCA PCQI TRAINING
    • SANITATION OPERATOR TRAINING
    • MICROBIOLOGY 101
    • FSPCA FOREIGN SUPPLIER VERIFICATION PROGRAM (FSVP) TRAINING FOR IMPORTERS OF FOODS FOR HUMAN AND ANIMALS
    • LABELING REQUIREMENTS FOR FOODS AND BEVERAGES
      MARKETED IN THE U.S.
    • GOOD MANUFACTURING PRACTICES
  • CONTACT US
  • Show Search
Hide Search

Laurie Post

Federal Agencies Publish A Joint National Strategy to Reduce U.S. Food Loss and Waste

Laurie Post · January 10, 2024 ·

Food waste is estimated at between 30 to 40 percent of the food supply in the United States. This figure, based on estimates from USDA’s Economic Research Service of food loss at the retail and consumer levels, corresponded to approximately 133 billion pounds and $161 billion worth of food in 2010. Food is the single largest category of material placed in municipal landfills. The U.S. Department of Agriculture (USDA), the Environmental Protection Agency (EPA), and the Food and Drug Administration (FDA) jointly published a draft strategy to prevent the loss and waste of food and increase organic waste recycling. The Draft National Strategy for Reducing Food Loss and Waste and Recycling Organics outlines targeted actions by USDA, EPA and FDA to mitigate the economic and environmental repercussions of wasted food. The strategy is a step towards meeting the national goal of reducing food loss and waste by 50% by 2030.

The four objectives of the strategy are:

  • Preventing the loss of food where possible.
  • Preventing the waste of food where possible.
  • Increasing the recycling rate for all organic waste.
  • Supporting policies that incentivize and encourage food loss and waste prevention and organics recycling.

For each objective, the draft strategy highlights actions that USDA, EPA, and FDA could take. Some of the priority USDA actions include:

  • Investing $30 million in the Composting and Food Waste Reduction (CFWR) Cooperative
    Agreements.
  • Expanding partnerships with NIFA food system programs to further develop educational
    materials, research and outreach for food loss and waste prevention.
  • Funding research and development on innovative new packaging technology to extend the shelf life of food and prevent loss.

Comments are invited on the Draft National Strategy for Reducing Food Loss and Waste and Recycling Organics. The public comment period opened on December 5 for thirty days. Share comments through Regulations.gov, Docket ID No. EPA-HQ-OLEM-2022-0415.

For more information about Food Loss and Waste Reduction activities visit:

  • USDA: Food Loss and Waste
  • FDA: Food Loss and Waste
  • EPA: Sustainable Management of Food

IFSAC Releases Foodborne Illness Source Attribution Estimates for 2021

Laurie Post · January 10, 2024 ·

The model estimated percentage of foodborne Salmonella, Escherichia coli O157, and Listeria
monocytogenes illnesses in 2021 attributed to each of 17 food source categories was recently released by the Interagency Food Safety Analytics Collaboration (IFSAC) made up of members from CDC, FDA, and USDA-FSIS.

The IFSAC group was established in 2011 to improve coordination of federal food safety analytic efforts and address priorities for food safety data collection, analysis, and use. IFSAC analyzes foodborne illness outbreak data for priority pathogens and specific foods and food categories responsible for foodborne illnesses in the United States. The data are analyzed by calendar
year and released in annual reports as part of ongoing efforts to understand sources of foodborne illness in the United States. The CDC estimates that together these priority pathogens — Salmonella, E. coli O157, Campylobacter, and L. monocytogenes — cause nearly two million cases of foodborne illnesses in the U.S. each year.

Foodborne illness source attribution estimates were generated from surveillance data collected between 1998 through 2021. The dataset included 1,322 outbreaks in which the confirmed or suspected implicated food or foods could be assigned to a single food category: 987 caused or suspected to be caused by Salmonella, 275 by E. coli O157, and 60 by L. monocytogenes. These include 46 outbreaks caused by
multiple serotypes of Salmonella. IFSAC assessed which categories of foods were most responsible for Salmonella, E. coli O157, and L. monocytogenes infections. These pathogens were chosen because of the frequency or severity of the illnesses they cause, and because targeted interventions can have a major impact in reducing them. The implicated foods were divided into 17 categories for the analysis. The method used for estimation gave the greatest weight to the most recent five years of outbreak data (2016–2020). The top food categories associated with each pathogen are detailed below.

For Salmonella, over 75% of illnesses were attributed to seven food categories including chicken, fruits, pork, seeded vegetables (such as tomatoes), other produce (such nuts), beef, and turkey. Estimated Salmonella illnesses were more evenly distributed across food categories than illnesses from E. coli O157, and L. monocytogenes.

Over 80% of E. coli O157 illnesses were attributed to vegetable row crops, such as leafy greens (lettuce, spinach), celeries, broccoli, and beef. Vegetable row crops had a significantly higher estimated attribution percentage than all other categories followed by beef.

For L. monocytogenes, over 75% of illnesses were attributed to dairy (fluid milk, hard and soft cheese), fruits (melons, apples, cherries, berries, mangoes, avocados), and vegetable row crops. However, the small total number of outbreaks (60) in the data set caused this estimate to be less reliable than estimates for the other pathogens.


The attribution of Salmonella illnesses to multiple food categories suggests that multiple types of
interventions are required to reduce illnesses from these pathogens. In contrast, the majority of E. coli O157 illnesses were attributed to two food categories suggesting that interventions for E. coli O157 focusing on these two food categories may be most effective in reducing illnesses. Most
L. monocytogenes illnesses were attributed to three food categories implicated in outbreaks in recent years.


Campylobacter attribution estimates were not provided. This was due to concerns about the limitations of using outbreak data that attributes Campylobacter illnesses to foods that are not routinely consumed by the general public. For example, 90% of dairy outbreaks involved raw milk and 55% of chicken outbreaks involved chicken livers, neither of which are readily consumed by the general public. As such, IFSAC analysts are developing other methods to estimate the sources of Campylobacter infection in future publications.

The authors advise that the estimates provided should not be interpreted as suggesting that all foods in a category are equally likely to transmit pathogens and comparisons over years can be skewed by a limited number of outbreaks. These results should be used with other scientific data for decision making. Overall, the attribution estimates can help inform efforts to prioritize food safety initiatives, interventions, and policies for reducing foodborne illnesses. The estimates also allow stakeholders (i.e. scientists; federal, state, and local policy-makers; the food industry; consumer advocacy groups; and the public) to assess whether prevention-oriented measures are working at intended.

Know Your Suppliers to Protect Your Products

Laurie Post · December 1, 2023 ·

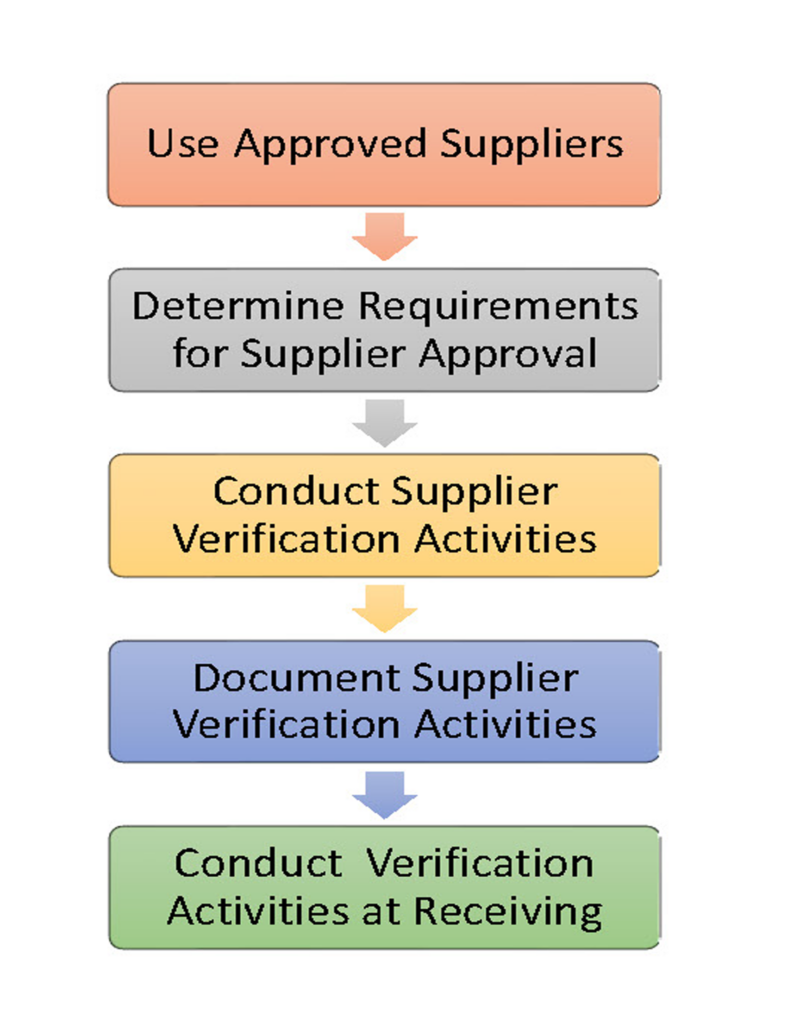
A Supply-Chain Control Program assures that the ingredients, raw materials, and non-food chemicals you receive are safe and suitable for use. Supplier control is an essential element of a preventive food safety system. The program is built on ingredient specifications that are defined following a hazard analysis, criteria for supplier selection, a process for approving suppliers, development of supplier agreements, and verification activities to assure that the program is in place and effective.

The hazard analysis identifies biological, chemical, physical, and Economically Motivated hazards associated with an ingredient that requires a control to significantly minimize or eliminate the hazard at your facility or at the supplier. It is critical to know what ingredients pose a food safety risk and who will control the identified hazard. If your supplier is controlling the hazard, then you should understand how they are accomplishing this. The food safety hazards presented by the supply chain are related to both the amount of control you have over the sourcing of the ingredient and the amount of transparency that you have with respect to the food safety practices of ingredient suppliers.

Approval of suppliers and ingredients should take place before the ingredient is received in your facility. Supplier Verification activities include audits of the supplier’s facility, reviews of their HACCP or Food Safety Plan, and verification testing of the ingredient at the supplier or upon receipt.

It is important to determine the ability and willingness of a supplier to meet your product specifications. A strong program is based on establishing a formal agreement with your supplier to ensure that they will share in the responsibility for food safety with respect to controlling hazards within their own facility. This may reduce the level of preventive controls needed by you upon receipt of the ingredient.

Your risk is lowest when every ingredient has a written specification detailing microbiological, chemical, and physical requirements as indicated by your hazard assessment and when each lot of ingredient is accompanied by a Certificate of Analysis (COA) reporting the results of appropriate verification testing from a trusted supplier. A robust in-bound receiving program with written procedures for reviewing COAs and documenting shipments with receiving records assures that each shipment meets your specification requirements. Even when other verification activities are in place, testing for hazards controlled by your supplier, at some designated frequency, provides additional evidence that supplier food safety systems are working. Your risk increases when you don’t require a COA for every lot purchased and do not require appropriate verification testing by the supplier or as part of your own receiving program.

Testing upon receipt may seem redundant when the supplier provides a COA. However, independent testing offers not only some assurance of the accuracy of the results reported on the COA, but also assurance that no adulteration of the ingredient has occurred between the time of analysis by the supplier and the time of receipt by the buyer. Verification of the supplier’s testing program as well as your own program should include corroboration that the laboratory performing the analyses is certified to conduct the tests and that methods are accredited and appropriate for testing the ingredients analyzed.

Good management of your suppliers will control microbiological, chemical, physical, Economically Motivated and food fraud hazards. For instance, as part of your Supply Chain Verification program, a review and approval of your supplier’s pathogen and allergen Preventive Control programs will minimize the risk that microbial contaminants and unlabeled allergens will enter your facility. This requires each supplier to have their own written programs. For ingredients you identify as having a particular pathogen concern, close the verification loop with an in-house program that screens statistically representative samples from each lot for the pathogen prior to use – either through a Preshipment Testing program or upon receipt.


The key to an effective Supply Chain Control Program is established policies and procedures and trusted suppliers with whom you are able to partner to prevent product safety issues.

Regulatory Update: FDA Releases FY 2021 Pesticide Residue Monitoring Report

Laurie Post · November 14, 2023 ·

The FDA published their annual Pesticide Residue Monitoring Program Report for Fiscal Year 2021 (FY 2021) on October 24, 2023.
The report summarizes findings from FDA testing of human and animal foods for approximately 750 different pesticides and selected industrial compounds from October 1, 2020, through September 30, 2021.


It is the legal responsibility of companies that produce and grow foods and manufacture products for food use sold in the U.S. to assure compliance with applicable Environmental Protection Agency (EPA) and FDA regulations.


The goal of the FDA’s pesticide residue monitoring program is to protect public health by assuring that pesticide tolerances, or maximum residue levels, set by the EPA are not exceeded in FDA-regulated foods shipped in interstate commerce and in foods imported into the U.S..

The FDA is responsible for enforcing pesticide tolerances. If the FDA finds that the amount of pesticide residue on a food is over the tolerance, or when a pesticide is found and there is no tolerance established, the FDA can take action. The findings of the 2021 monitoring program show that the levels of pesticide chemical residues measured by FDA in the U.S. food supply are generally in compliance with EPA pesticide tolerances.


Link: 2021 Report (PDF: 572 KB)


FDA selectively monitors a broad range of domestic and import commodities for residues of approximately 750 different pesticides and selected industrial compounds. FDA may also carry out focused sampling surveys for specific commodities or selected pesticides of special interest. In addition, FDA monitors the levels of pesticide chemical residues in foods prepared for consumption in its Total Diet Study (TDS), an ongoing program that monitors contaminants and nutrients in the average U.S. diet.

As with FY 2020, sample collection and analysis in FY 2021 was significantly impacted by the COVID-19 pandemic. Approximately 68% fewer human food samples and 78% fewer animal food samples were collected in FY 2021 compared with FY 2019, the most recent year not impacted by the global pandemic. Sample collection and analysis increased in FY 2022.

Overall Findings
Human Food Samples:
1,367 total samples (300 domestic food samples from 26 states and 1,067 imported food samples from 66 countries/economies).

  • 96.7% of domestic samples and 89.3% of imported samples were compliant with federal regulations (below EPA tolerances).
  • No pesticide chemical residues were detected in 35.0% of domestic samples and 44.5% of imported samples.


Animal Food Samples: 80 total samples (16 domestic food samples from 5 states and 64 imported samples
from 7 countries).

  • 100% of domestic samples and 98.4% of imported samples were compliant with federal
    regulations (below EPA tolerances).
  • No pesticide chemical residues were detected in 37.5% of domestic samples and 40.6% of
    imported samples.

Due to the low sample numbers, only limited conclusions can be drawn from the results. However, the violation rates for both human and animal food samples in FY 2021 were similar to recent years.

Food Allergens – Understanding The Hazards

Laurie Post · November 14, 2023 ·

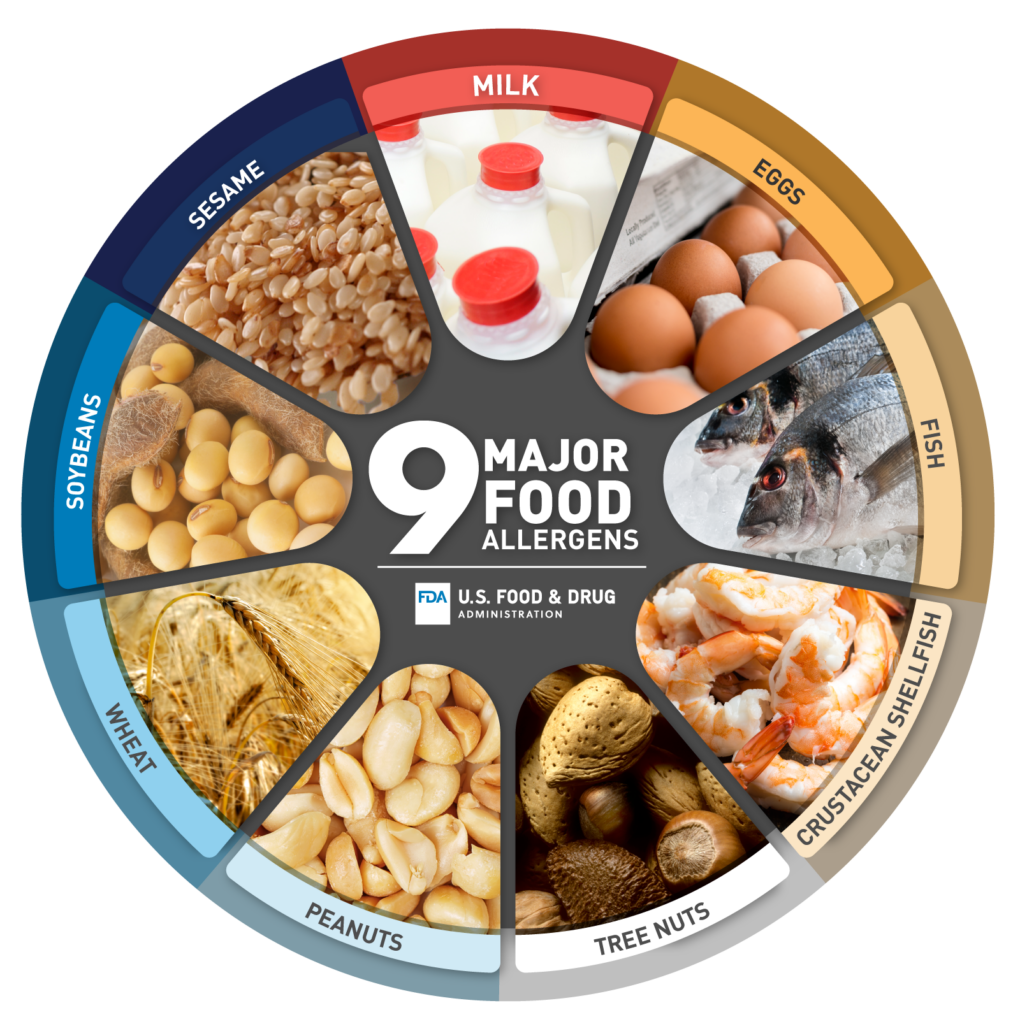
Violations due to food allergen hazards are a major food safety concern globally. In a recent article in the Journal of Food Protection, FDA reviewed recalls associated with major food allergens (MFA) and gluten in FDA regulated foods from fiscal years 2013 to 2019. The review distilled information about the foods most frequently implicated in allergen recalls and the specific food allergens associated with recalled products. The root causes of the recalls that occurred over the time period studied were also examined.


During fiscal year 2013-2019, 1417 allergen related recalls were reported. Most of the recalls (97%) were classified as Class I (51%), posing a reasonable probability of serious adverse health consequences or death or Class II (46%), posing a remote probability of serious adverse health consequences or temporary/reversible adverse health consequences. Of the 1471 recalls, 1415 recalls were due to MFAs, 34 recalls were due to a gluten-free labeling violation, and 23 recalls involved other allergens. Milk was the most common allergen involved in MFA recalls (37.5%), followed by soy (22.5%) and tree nuts (21.6%). Almond, anchovy, and shrimp were the most common allergens recalled within the MFA groups of tree nuts, fish, and Crustacean shellfish, respectively. About 97% of MFA recalls involved one product category and among them, the category of ‘bakery products, dough, bakery mixes and icings’ ranked first (367 recalls), followed by the category of ‘chocolate and cocoa products’ (120 recalls).

The top five recalled food product categories – major food allergens implicated and number of recalls.

Product CategoriesMultiple MFACrustacean
Shellfish
EggFishMilkPeanutSoyTree NutWheatTotal
Bakery
Products,
dough, bakery
mixes, and
icings
8303318922337531387
Chocolate and
cocoa
products
2201042257203120
Multiple food
dinners,
gravies,
sauces, and
specialties
312158201101112110
Snack foods
(flour, meal, or
vegetable
base)
9031456116586
Ice cream and
related
products
12050820223272
Adapted from G. M. Sharma et.al. 2023.

The “mode of discovery” for allergen issues leading to a recall was also examined. These issues were most often detected by consumer and downstream customer complaints.

DiscoveredDescriptionNumbers of recalls % of total recalls
ComplaintIncludes complaint from consumer, downstream customer,
distributor, or others; did not involve allergic or other adverse
reactions
39227.7
FDAIncludes inspection or other means of discovery by FDA19313.6
FirmIncludes recalling firm, manufacturing firm, or responsible firm27919.7
Other governmentIncludes inspection, notification or other means of discovery by
State agencies, other federal agencies, or foreign government
21515.2
ReactionIncludes consumer adverse reaction associated with the
consumption of the product
1258.8
Unknownmode of discovery not identified based on available information to
FDA
21114.9
Adapted from G. M. Sharma et.al. 2023.

Nineteen different root cause categories were identified for the MFA recalls that occurred during the period studied. Overall, allergen labeling and packaging errors were the major sources of issues resulting in 64.6% (N = 914) of total MFA recalls.

Allergen cross-contact, defined as the unintentional incorporation of a food allergen into a food, resulted in 21.3% (N = 301) of total MFA recalls. Sources of unintended allergen presence in food products were related to processing or production such as a mix-up in rework, the use of a wrong ingredient that was not communicated on the product label (5.6% of total MFA recalls), or inadequate sanitation practices (7.1% of total MFA recalls).
1163 recalls out of 1415 MFA recalls were traced to a specific root cause. Considering all sources of
allergen issues, these were identified as the most common root causes:
◼ 662 recalls were traced to errors in labeling and packaging.
◼ 307 recalls were traced to raw or incoming ingredients.
◼ 194 recalls were traced to processing or production errors within the facility.

Root CauseExamples
No carry-through • MFA in sub-ingredient not declared on the final product
• MFA in an incidental additive not declared on final product
Wrong Package • Use of wrong primary or secondary package
• Mix-up of wrong package at supplier or manufacturer level
Wrong Label• Use of wrong label or one labels on the product is wrong
• Label mix-up at supplier or manufacturer level
Terminology• Ingredient is declared but its MFA source is not
Cross-contact• Sanitation issues
• Change-over or sequencing issues
Wrong ingredient• Use of wrong formulation or recipe
• Use of wrong sub-product in a composite product kit
Adapted from G. M. Sharma et.al. 2023.

Identification of allergen controls that could mitigate the source of allergen errors are listed below. Label controls (includes label content controls and label management controls) could have prevented 893 out of 1163 MFA recalls (76.8%), whereas allergen cross-contact controls and supply chain controls could have prevented 16.7% and 6.5% MFA recalls, respectively.

Allergen controlsSource of problemRoot causeNumber of recalls% of total recalls
Cross-contact controlsProcessing or productionIn process171.5
Other cross-contact796.8
Positive allergen test171.5
Rework161.4
Wrong ingredient655.6
Total cross-contact controls19416.7
Label content controls Labeling and packagingComputer error534.6
Foreign language121.0
Knowledge 342.9
No declaration 252.2
Not updated564.8
Partial declaration353.0
Terminology12110.4
Raw or incoming ingredientsNo carry-through23119.9
Total label content controls56748.8
Label management controlsLabeling and packagingWrong label16113.8
Wrong package16514.2
Total label management controls32628.0
Supply Chain ControlsRaw or incoming ingredientsIngredient mislabeled211.8
Other cross-contact221.9
Positive allergen test191.6
Wrong ingredient141.2
Total supply chain controls766.5
Total allergen controls1163100.0
Adapted from G. M. Sharma et.al., 2023.

Recent guidance documents listed below provide useful information for food allergen hazard assessments and associated controls.

CPG Sec 555.250 DRAFT: Major Food Allergen Labeling and Cross-contact | FDA

-Major Food Allergen Labeling and Cross-contact Draft Compliance Policy Guide (CPG)

Update to Draft Guidance for Industry: Hazard Analysis

-Chapter 11: Food Allergen Program

Source of information: FDA.gov

  • Go to page 1
  • Go to page 2
  • Go to page 3
  • Go to Next Page »

READY TO WORK TOGETHER?

Request a quote from one of our sales professionals. Contact Us

Footer

CONTACT US

Have a question? Contact our Sales team.

Request Info

Subscribe to our newsletter

Subscribe

“Science you can trust from concept to consumer -since 1967”

We are proud of our integral role in helping to ensure product safety and quality for all our clients.

  • Facebook
  • LinkedIn
  • Twitter

CAREERS

Deibel Laboratories is always seeking energetic individuals to fill positions at our rapidly growing corporation of food and pharma/cosmetic testing laboratories.

VIEW CAREERS

LOCATIONS

California, Idaho, Pennsylvania, Sarasota, Gainesville, Lakeland, Illinois, Minnesota, Missouri, Wisconsin, Kansas, Tennessee, Texas, Canada

SEE LOCATIONS

Copyright © 2025 Deibel Laboratories, All Rights Reserved.
PRIVACY NOTICE · COOKIE POLICY · TERMS AND CONDITIONS