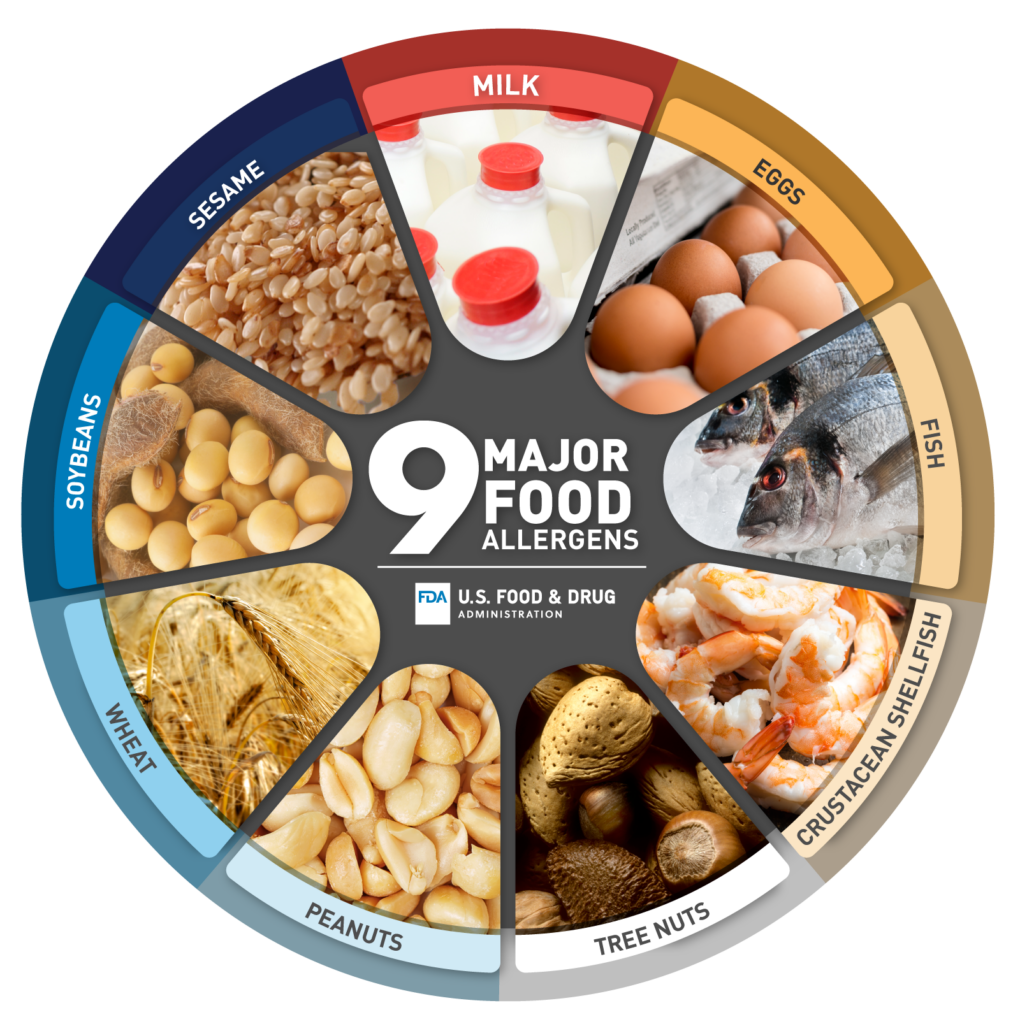
Violations due to food allergen hazards are a major food safety concern globally. In a recent article in the Journal of Food Protection, FDA reviewed recalls associated with major food allergens (MFA) and gluten in FDA regulated foods from fiscal years 2013 to 2019. The review distilled information about the foods most frequently implicated in allergen recalls and the specific food allergens associated with recalled products. The root causes of the recalls that occurred over the time period studied were also examined.

During fiscal year 2013-2019, 1417 allergen related recalls were reported. Most of the recalls (97%) were classified as Class I (51%), posing a reasonable probability of serious adverse health consequences or death or Class II (46%), posing a remote probability of serious adverse health consequences or temporary/reversible adverse health consequences. Of the 1471 recalls, 1415 recalls were due to MFAs, 34 recalls were due to a gluten-free labeling violation, and 23 recalls involved other allergens. Milk was the most common allergen involved in MFA recalls (37.5%), followed by soy (22.5%) and tree nuts (21.6%). Almond, anchovy, and shrimp were the most common allergens recalled within the MFA groups of tree nuts, fish, and Crustacean shellfish, respectively. About 97% of MFA recalls involved one product category and among them, the category of ‘bakery products, dough, bakery mixes and icings’ ranked first (367 recalls), followed by the category of ‘chocolate and cocoa products’ (120 recalls).
The top five recalled food product categories – major food allergens implicated and number of recalls.
| Product Categories | Multiple MFA | Crustacean Shellfish | Egg | Fish | Milk | Peanut | Soy | Tree Nut | Wheat | Total |
|---|---|---|---|---|---|---|---|---|---|---|
| Bakery Products, dough, bakery mixes, and icings | 83 | 0 | 33 | 1 | 89 | 22 | 33 | 75 | 31 | 387 |
| Chocolate and cocoa products | 22 | 0 | 1 | 0 | 42 | 25 | 7 | 20 | 3 | 120 |
| Multiple food dinners, gravies, sauces, and specialties | 31 | 2 | 15 | 8 | 20 | 1 | 10 | 11 | 12 | 110 |
| Snack foods (flour, meal, or vegetable base) | 9 | 0 | 3 | 1 | 45 | 6 | 11 | 6 | 5 | 86 |
| Ice cream and related products | 12 | 0 | 5 | 0 | 8 | 20 | 2 | 23 | 2 | 72 |
The “mode of discovery” for allergen issues leading to a recall was also examined. These issues were most often detected by consumer and downstream customer complaints.
| Discovered | Description | Numbers of recalls | % of total recalls |
|---|---|---|---|
| Complaint | Includes complaint from consumer, downstream customer, distributor, or others; did not involve allergic or other adverse reactions | 392 | 27.7 |
| FDA | Includes inspection or other means of discovery by FDA | 193 | 13.6 |
| Firm | Includes recalling firm, manufacturing firm, or responsible firm | 279 | 19.7 |
| Other government | Includes inspection, notification or other means of discovery by State agencies, other federal agencies, or foreign government | 215 | 15.2 |
| Reaction | Includes consumer adverse reaction associated with the consumption of the product | 125 | 8.8 |
| Unknown | mode of discovery not identified based on available information to FDA | 211 | 14.9 |
Nineteen different root cause categories were identified for the MFA recalls that occurred during the period studied. Overall, allergen labeling and packaging errors were the major sources of issues resulting in 64.6% (N = 914) of total MFA recalls.
Allergen cross-contact, defined as the unintentional incorporation of a food allergen into a food, resulted in 21.3% (N = 301) of total MFA recalls. Sources of unintended allergen presence in food products were related to processing or production such as a mix-up in rework, the use of a wrong ingredient that was not communicated on the product label (5.6% of total MFA recalls), or inadequate sanitation practices (7.1% of total MFA recalls).
1163 recalls out of 1415 MFA recalls were traced to a specific root cause. Considering all sources of
allergen issues, these were identified as the most common root causes:
◼ 662 recalls were traced to errors in labeling and packaging.
◼ 307 recalls were traced to raw or incoming ingredients.
◼ 194 recalls were traced to processing or production errors within the facility.
| Root Cause | Examples |
|---|---|
| No carry-through | • MFA in sub-ingredient not declared on the final product • MFA in an incidental additive not declared on final product |
| Wrong Package | • Use of wrong primary or secondary package • Mix-up of wrong package at supplier or manufacturer level |
| Wrong Label | • Use of wrong label or one labels on the product is wrong • Label mix-up at supplier or manufacturer level |
| Terminology | • Ingredient is declared but its MFA source is not |
| Cross-contact | • Sanitation issues • Change-over or sequencing issues |
| Wrong ingredient | • Use of wrong formulation or recipe • Use of wrong sub-product in a composite product kit |
Identification of allergen controls that could mitigate the source of allergen errors are listed below. Label controls (includes label content controls and label management controls) could have prevented 893 out of 1163 MFA recalls (76.8%), whereas allergen cross-contact controls and supply chain controls could have prevented 16.7% and 6.5% MFA recalls, respectively.
| Allergen controls | Source of problem | Root cause | Number of recalls | % of total recalls |
|---|---|---|---|---|
| Cross-contact controls | Processing or production | In process | 17 | 1.5 |
| Other cross-contact | 79 | 6.8 | ||
| Positive allergen test | 17 | 1.5 | ||
| Rework | 16 | 1.4 | ||
| Wrong ingredient | 65 | 5.6 | ||
| Total cross-contact controls | 194 | 16.7 | ||
| Label content controls | Labeling and packaging | Computer error | 53 | 4.6 |
| Foreign language | 12 | 1.0 | ||
| Knowledge | 34 | 2.9 | ||
| No declaration | 25 | 2.2 | ||
| Not updated | 56 | 4.8 | ||
| Partial declaration | 35 | 3.0 | ||
| Terminology | 121 | 10.4 | ||
| Raw or incoming ingredients | No carry-through | 231 | 19.9 | |
| Total label content controls | 567 | 48.8 | ||
| Label management controls | Labeling and packaging | Wrong label | 161 | 13.8 |
| Wrong package | 165 | 14.2 | ||
| Total label management controls | 326 | 28.0 | ||
| Supply Chain Controls | Raw or incoming ingredients | Ingredient mislabeled | 21 | 1.8 |
| Other cross-contact | 22 | 1.9 | ||
| Positive allergen test | 19 | 1.6 | ||
| Wrong ingredient | 14 | 1.2 | ||
| Total supply chain controls | 76 | 6.5 | ||
| Total allergen controls | 1163 | 100.0 |
Recent guidance documents listed below provide useful information for food allergen hazard assessments and associated controls.
CPG Sec 555.250 DRAFT: Major Food Allergen Labeling and Cross-contact | FDA
-Major Food Allergen Labeling and Cross-contact Draft Compliance Policy Guide (CPG)
Update to Draft Guidance for Industry: Hazard Analysis
-Chapter 11: Food Allergen Program
Source of information: FDA.gov


